


I simulated a free market economy in Minecraft, here are my results (Part 2)
Part 2 - The Macroeconomics of Minecraft (Results)

This is part 2 of a planned three part series on the economics of Minecraft. Part 1 provides some helpful context, although it is not necessary to read if you are simply here to see the results of my experiment.

Note: this article is still in the draft stage. Let me know if there are any major spelling or grammatical issues, thanks ;)
Data and Methodology
In part one of our series, we discussed how economists measure and model basic economic activities such as production and trade. In this section, we will be iterating upon our earlier work in attempt to calculate actual macroeconomic metrics (such as GDP and inflation) in relation to our Minecraft server.
Before we introduce these concepts, however, it’s worth discussing the dataset we will be working with, and how I collected it. Our data spans T=50 real life days, charting the economic behaviour of n=11 players, across t=1,163 transactions. For the purposes of protecting my friends’ privacy, I have altered the real usernames of players to generic placeholder names that vaguely fit their playstyle.
T=50 - number of days the experiment ran for
n=11 - players actively participating in the economy
t=1,163 - total transactions, representing a snapshot of the economy at a given time
My data was collected by having my Minecraft server send transaction logs to a mySQL server every time an in-game purchase occurred. This gives us 1,163 snapshots of the state of the economy over the course of 50 days. Once the simulation was over, I downloaded the logs and processed them using a python script.

Summary of Results
To recap, in section 1 we chose a conversion rate of 1 diamond to 1,000 dollars for our currency. This means that, for the statistics seen in figure 2, to get our values in terms of diamonds you simply divide the dollar amount by 1,000. For instance, the wealth of all players accrued by the end of the server was $3,108,168, which is roughly equivalent to 3,108 diamonds.

Figure 2- Table summarising the state of the economy, $1,000 = 1 diamond
As figure 2 shows, our server had 308 shops, selling a total of 76,931 items. Gross domestic product (GDP) was calculated to be $4,526,041 by summing the income of our shops across all transactions, following the income method. If you are unfamiliar with what gross domestic product measures, it is the main way economists measure economic activity. Like the name suggests GDP is the “gross” (or total) amount of products that are produced domestic(ally) within a given region over a fixed period of time. As such, measuring your GDP will give you a good indication as to how active your economy is. In our case, a GDP per capita of $411,458 tells us that, on average, people spent around 411 diamonds on goods over the course of our 50 day experiment. As we will come to see, however, not everyone contributed to the economy equally.
If you are unfamiliar with GDP as a variable it may surprise you that our value is significantly larger, by around $1,400,000, than our total wealth figure of $3,108,168. There is a good reason for this, and this phenomena is known as the multiplier effect in economics. Before we discuss why this is, however, it is worth going over some of the immediate findings of our data.

GDP and Wealth
Wealth Inequality
Wealth inequality is treated by some as a mathematical inevitability. As if, by necessity, all sociological phenomena must follow a pareto distribution with the majority of resources concentrating in the hands of the wealthy few. Spawning into the server, all players are equal and start off with a balance of $10,000 or the equivalent of 10 diamonds. Over the course of the 50 days, however, the server became much less equitable, with the top player controlling over 32% of the total server wealth and the top 3 players controlling roughly 88% of the wealth.

Figure 3- Individual player wealth over time. Scale in millions of dollars.
One of the interesting results of our simulation was seeing how many real life economic phenomena translated to Minecraft. Indeed, the original inspiration for this experiment was a 2018 research paper titled “Minecraft Economics: A Study of Wealth Inequality in a Virtual World”. In the economics study, American researchers looked at how wealth was distributed across several public Minecraft servers. The researchers found that “virtual economies lacking redistributive policies appear to generate more inequality than real economies”, although their methodology is quite flawed. Indeed, many of the servers they surveyed allow for players to gain money simply by donating. This is not emblematic of a true virtual economy, so much as a reflection of our own society’s endemic issue of wealth inequality.
My experiment, by contrast, had no way for players to easily gain wealth, except by mining or selling goods to other players - two labour intensive activities. Nonetheless, we do see quite a radical disparity in outcomes. Why is this?
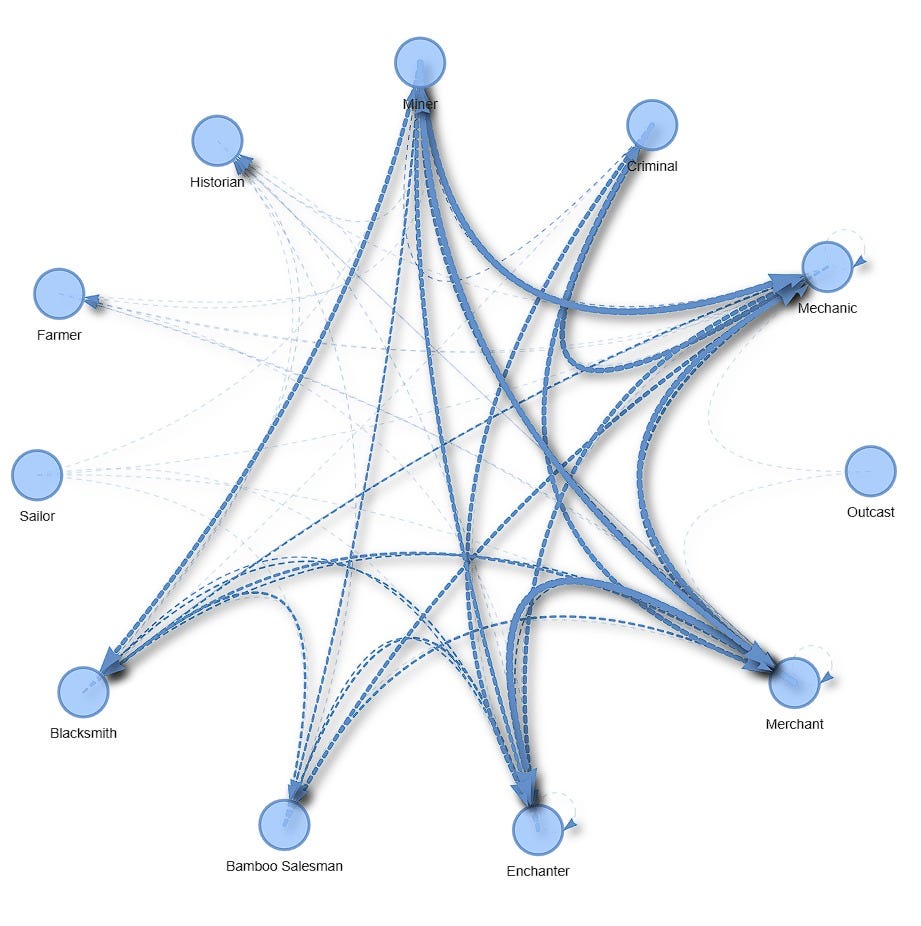
Figure 4 - A network graph representing the flow of funds between players. The thickness of the arrow is proportional to the volume of funds exchanged.
Above is a “network graph” depicting the flow of funds between players. As we can see, many of the same players who controlled most of the wealth in figure 3 also seem to be the players most engaged in economic activity; that is, buying and selling goods. The poorest players, Sailor, Farmer, Outcast and Historian are also the players with the lowest levels of economic participation. This suggests that the players who ended up better off did so because they participated more in the economy, reaping the benefits of being both a producer and consumer. To fully test this theory, we can run a simple linear regression of the total amount of hours played against the maximum balance players achieved.

Figure 5 - A scatter plot depicting the correlation between the maximum level of wealth achieved by players and their total play time in hours.
As we can see by the regression results below (and graphed in figure 5), the coefficient for the regressor hours_played was estimated to be 3,902. This means that, for each hour a player is on the server, it is expected that their max wealth go up by around $3,902. This result is statistically significant at the 1% level, explaining at least 70% of the variation in wealth. Thus, I largely reject the narrative presented in the 2018 paper that wealth inequality is a natural function of virtual market economies under “pure capitalism”.
==============================================================================
Dep. Variable:            max_balance   R-squared:                       0.707
Model:                            OLS   Adj. R-squared:                  0.675
Method:                 Least Squares   F-statistic:                     21.75
Date:                                   Prob (F-statistic):            0.00118
Time:                        --:--:--   Log-Likelihood:                -150.20
No. Observations:                  11   AIC:                             304.4
Df Residuals:                       9   BIC:                             305.2
Df Model:                           1
Covariance Type:            nonrobust
===============================================================================
                   coef    std err          t      P>|t|
-------------------------------------------------------------------------------
const         5.508e+04   1.02e+05      0.542      0.601
hours_played  3902.7030    836.859      4.664      0.001
==============================================================================
While it may be the case that a lack of redistributive policies leads to wealth inequality in the real world, the wealth inequality experienced in my server largely seems to be a result of direct player choice. Another possible interpretation for the wealth inequality, is that players who found early success in the economy felt more motivated to log back on and spend more time on the server. Nonetheless, it would be interesting to see how redistribution policies could impact virtual economies, like those seen in Minecraft. Would it lead to higher player retention or demotivate players to engage in economic activity in game?

GDP fluctuations
Regarding GDP fluctuations, the graph below (Figure 6) shows the GDP generated on each day across the 50 day experiment. As we can see, there is a great deal of variance in this figure. Is this evidence of a virtual business cycle? Well… probably not. To understand why this may be, it is worth looking at the volume of transactions, represented on the left axis with the dotted line.

Figure 6 - A network graph representing the flow of funds between players.
On days where there was a significant amount of transactions, the GDP tended to be higher. The one exception for this was day 37, where the daily GDP approached its maximum of $600,000 despite having fewer than 40 transactions. This indicates that GDP is generally correlated with player activity. Indeed, the most active days tended to be on the weekends, off university and work hours (see figure 7).

Figure 7 - Bar graph showing Friday, Saturday, Sunday and Monday to be the days of the week most active.
One limitation of this result is that it makes it difficult to disentangle our in-game economic results from real world cyclical trends. Fluctuations in GDP cannot be interpreted as fluctuations in the underlying productivity or health in the economy, but rather, reflect the ability of players to partake in the experiment. In section 3, I will discuss some of the challenges of disentangling real-life phenomena from virtual economic ones. Indeed, as much as I wish I could say I managed to simulate business cycles in Minecraft, I do think the cyclicality represented is largely due to exogenous factors. This does not mean, however, that these results are trivial. In fact, the cyclicality manifested is emblematic of many real world economic trends. Chances are your local restaurant and movie theatre follow a similar distribution to the one graphed in figure 7.

The Multiplier Effect
What is absolutely not a property of external factors, however, is the observable multiplier effect that bore out in the virtual economy. As I teased earlier in this piece, our gross domestic product was over 1,400,000 dollars higher than the total server wealth. For those unacquainted with the multiplier effect, it should seem impossible that a country could produce more goods than could be accounted for in dollar amounts… right?
The multiplier effect is an observed economic phenomenon whereby an increase in government spending equivalent to - lets say - 100 dollars, results in a rise in output/GDP of an amount greater than 100 dollars. The mathematics underlying this theory is quite simple:
For the sake of simplicity, lets imagine a world where there can only be $100 circulating in the economy at one time.
Lets also suppose that a consumer is given $100 for free and decides to save $10 and spend the remaining $90 at a local bakery.
That $90 becomes income for the bakery and thus is counted as $90 in the GDP using the income method.
The baker may then decide to save $10, and spend the remaining $80 to buy new stock of flour from a farmer.
Because the farmer now has now made $80 as income, the GDP has risen to $170, despite only $100 existing in this fictional economy. This cycle would theoretically continue until the quantities saved and spent become infinitesimally small.
This approach of using direct cash payments to stimulate the economy may seem familiar to you as it is exactly the strategy many governments employed during the Covid-19 recession and the global financial crisis. Although there was no central bank to distribute money to players directly, we still see an example of the fiscal multiplier as we had a gross domestic product much greater than the total amount of money circulating in our economy (see figure 8 below):

Figure 8 - Graph of cumulative GDP and total server wealth over time. Notice the wide gap between GDP and total server wealth
So what is the fiscal multiplier for our server. Well from an introduction of 3,108,168 dollars we managed to stimulate 4,526,041 dollars worth of economic activity. This makes our multiplier roughly 1.46, meaning for every dollar we introduce into the economy we should see an extra 46 cents of economic activity. If we want to work out how much our players are saving, we can use our calculated multiplier to solve for the marginal propensity to save which represents how much our players will save from an increase in their income:
Thus our MPS is:
This means that roughly 68% of the diamonds that are mined by players are saved and not used to purchase goods. The remaining 31% is used for consumption. A big reason why players may be saving is likely due to the fact that diamonds are used for crafting items and thus have an intrinsic use value beyond transactions. This, incidentally, brings me to the next point of analysis which is the issue of deflation.

Deflation, Money Supply and Bitcoin
In a world where inflation is cannibalising people’s pay checks and exacerbating the global cost of living crisis, it may seem almost therapeutic to inhabit a virtual world where the purchasing power of your currency only goes up. This seems to be the pitch of many crypto currency and “stable coin” investors, who market their financial products as credible hedges against the US dollar’s inevitable price collapse. But is this prophesised system of international finance the obvious panacea it is hyped up to be or does deflation come with some serious downsides.
Deflation, or negative inflation, occurs when prices in an economy systematically drop over a fixed period of time. The causes of deflation are varied, but the general impact is the same: your purchasing power increases but so too does your incentive to save. Consequently, if deflation is persistent, it can damage the economy by disincentivising spending and thus economic activity. But is this what happened in our server? Figure 9 shows the inflation rate over the 50 day experiment. As we can see, on most days the average prices in our economy fell, typically between -2.5% and -5%.

Figure 9 - Graph of inflation rate over time. Negative inflation is the same as deflation.
Cumulatively prices fell by 35%, meaning an item that costed $1000 on day 1 on average costed $350 less, or $650 on day 50. While this may sound good from the perspective of consumers, it generally means that consumers will be incentivised to spend less, not more. There is an exception to this logic, which is whether or not the observed deflation is a consequence of market forces or if it is a consequence of a diminishing money supply. If it is the former, then deflation may actually be a good thing, because it means that goods are being produced more efficiently and in larger quantities. If it is the latter, then the diagnosis may be a bit bleak as it means the supply of diamonds is not able to keep up with demand for diamonds as currency, thus potentially stifling output growth.
Interpretation 1 - Diminishing Marginal Money Supply?
As I alluded to in section 1 and earlier in this piece, our system of currency is very similar to the gold standard and crypto currencies such as Bitcoin. Essentially, there is a (theoretically) fixed supply of money or diamonds that can be easily outpaced by growth in population and increases in economic output. Even if gold mining (in real life) or diamond mining (in Minecraft) were to increase, there would be diminishing marginal returns as players will have to travel further and further to get more and more diamonds, thus increasing the time it takes to introduce diamonds into the economy. This is, in fact, how “Bitcoin mining” works, where the quantity of Bitcoin awarded for each ‘block’ mined has halved every four years.
Just like with Bitcoin and the gold standard, you would expect an economy like this to experience systematic deflation, particularly if the marginal cost of mining new resources increases alongside money demand. To test whether stifled money supply is to blame for our server’s deflation we can look to a plot of daily changes in money supply and compare that to our plot of the daily inflation rate.

Figure 10 - Graph of changes in money supply (blue) and inflation rate (red).
As the graph above indicates (figure 10) changes in money supply and deflation do not seem to be meaningfully correlated. Indeed, in several periods where the money supply increased by magnitudes of $200,000 and above, the economy still experienced sizable deflation rates of -7 to -2 percent. Furthermore, although there are some periods of negative money supply growth, that is to say diamonds are exiting the economy, these negative periods do not correspond to periods of deflation, challenging the assumption that excess money demand is to blame.
This suggests that it must be another phenomenon that is causing the immense levels of deflation.
Interpretation 2 - Deflation as Equilibrium Phenomena
The law of supply and demand implies that in a competitive market, if producers are able to supply more goods, and demand remains fixed, then prices should fall. This is true for individual markets, as in, markets for particular goods, but this can also be true-economy wide. For instance, if the aggregate of supplied goods in a market increases, then the price level should decrease, as the average price that is charged to consumers should also decrease.
This is one way of explaining deflation, and indeed inflation (with the forces in reverse order). So if market forces are to blame for our server’s rampant deflation, then we should see increased competition leading to lower prices for goods and thus deflation. To keep our examples simple, lets begin by looking at the market for a homogenous good like cooked beef.

Figure 11 - Price competition of cooked beef market between two sellers.
As the graph above illustrates, the introduction of a second seller of cooked beef immediately resulted in a dramatic price decrease of cooked beef, from $25 to $10. We can see a price equilibrium form with both players essentially choosing the same price of cooked beef of roughly ~$9.

Figure 12 - Quantity of Cooked Beef sold vs. Price of cooked beef
If we graph the price and quantity of cooked beef according to the seller, we can see as the first player (the Merchant) lowered their prices, people were willing to consume more cooked beef. This likely indicates that there was excess demand for the good, with players waiting for a lower price to consume at. After the second player (the Blacksmith) enters the market, however, the quantity sold becomes less correlated with the price, likely due to the fact that neither supplier is willing to deviate from their chosen price and that demand for the good is being more or less satisfied.

Figure 13 - Changes in prices of goods vs. the number of suppliers providing that good
The way we can know for sure whether market competition is to “blame” for the high levels of deflation is to plot price changes of goods against the number of people supplying them. Figure 13 shows a box plot graph representing all goods on the server, with the x-axis measuring how much that good has fallen in price across the 50 days, and the y-axis representing the amount of suppliers of that good. As we can see, for goods sold by just one person, the mean is incredibly concentrated around the inflation=0 line, as represented by the blue dashed line. By contrast, as we look at goods that have more and more suppliers such as the orange and green boxplots, prices begin to fall dramatically. This indicates that it is likely equilibrium forces, IE: supply and demand that are to explain the negative inflation rates on the server rather than limited money supply.

So what is Minecraft’s Macroeconomic Profile?
It’s easy to look at videogames as a modern extension of the ancient tradition of board gaming or even physical sports. But to the extent that video games are different to these mediums as a form of entertainment, it is in the level of immersion that it inspires in its players. Such is the level of immersion that players will naturally imitate real-life economic strategies and dynamics, all without the real, material motive of a cash reward.
Studying virtual economies has its value, as it gives us insights into how humans might behave if certain fundamental assumptions about resource scarcity or our economic institutions were different. Deprived of real-world power structures and incentives, virtual economies are the closest things to an economic tabula rasa from which to study human nature and cognition as it pertains to economic decision making. To the extent that this project has a message, it is that studying virtual economies is not only possible but valuable as it could perhaps advance our understanding of economics by being a conduit for research into heterodox and experimental economic policies. Indeed, this is a much preferable environment for experimentation as it does not carry with it the baggage of catastrophic consequences if your test goes awry.
So to summarise five-key points of my research:
Wealth inequality is not seemingly an inevitable feature of Minecraft’s in-game economy like past economic research has concluded
Unsurprisingly, the real world still has a great deal of influence on virtual economies even if there is no way to directly transfer real world success to the virtual world, experiments and simulations will always be constrained by exogenous factors outside of a researchers control, such as time commitments.
The Multiplier Effect can be observed even in a game as open ended as Minecraft.
Deflation appears to be the natural state of Minecraft’s economy, although it is also possible that with a long enough time frame, supply-side competition will reach a plateau and money supply will begin outpacing money demand.
Many of the same pricing strategies we see in real life get adopted by players. Players will naturally converge at a equilibrium, likely reflecting their marginal costs in game.
I hope that you have found my research insightful or at the very least entertaining. In the next section I will be discussing some of the methodological observations I have made in the course of producing this research.
By: Abdur-Rahman Butler

This is excellent!